
Real Time
Real time / near real time data to help see what's going on.


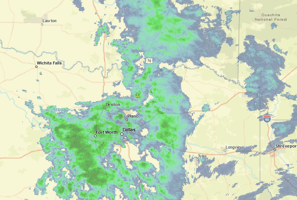
Radar
Weather radar - US and Global
Wind
Wind speed & viz tools
Tidal Gauges
Coastal tidal water levels
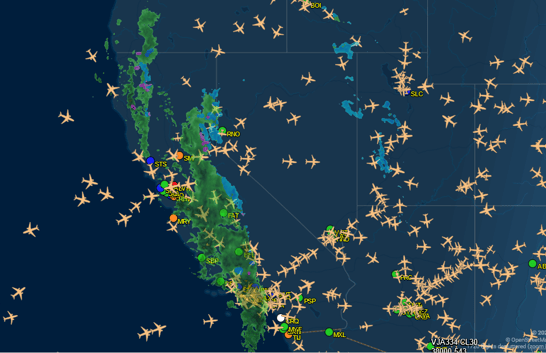
Airplane Traffic
View planes detour the storm
Rain Totals
Rainfall total reports
Power Outages
Power outage maps/numbers
Buoy's
Buoy data and cams
Outdoor Cams
View on the ground conditions
River Gauges
River levels - flood/surge
Lightning
Traffic Cams
Crowd Source
Can strike 10+miles from storm
See the road conditions live
Expedited data collections


Radar
Weather radar - US & Global

NWS/NOAA
US Weather Radar
US weather radar composite. See section further below for regions around the globe.
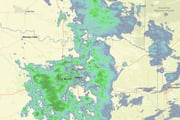
world wide
Global Weather Radar
Individual and some composite weather radar sites from around the globe.
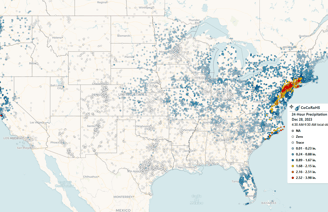
Rain Totals
Rainfall total reports

24-hr rain total maps, typically updated around sunrise each day by public members of CoCoRaHS network. Select a specific state for more detailed results, full list below the map. For information on how you can join this great network visit: https://www.cocorahs.org/

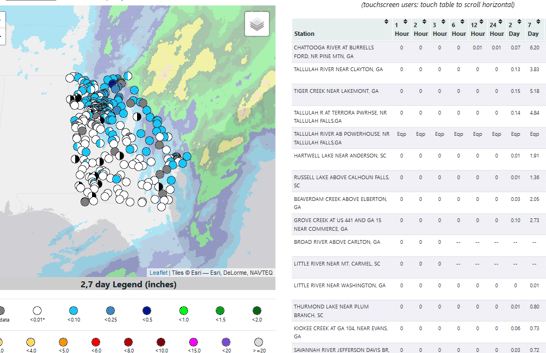
Georgia only - USGS rain gauges with totals available in 1, 2, 3, 6, 12, 24, 48 hour maps as well as 7-day totals. Can add overlay of gauge numbers and radar estimated rainfall colors. Sort data on right.
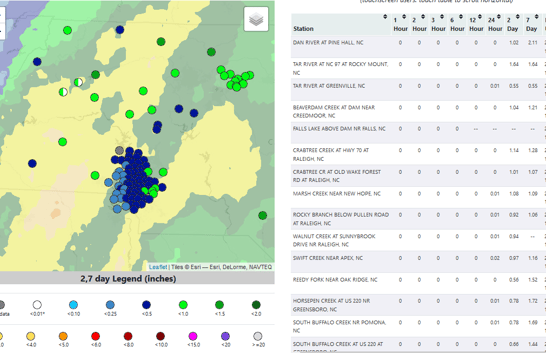
North Carolina only - USGS rain gauges with totals available in 1, 2, 3, 6, 12, 24, 48 hour maps as well as 7-day totals. Can add overlay of gauge numbers and radar estimated rainfall colors. Sort data on right.
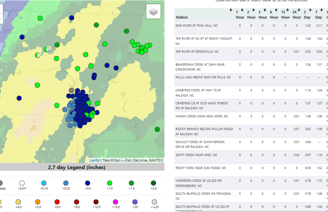
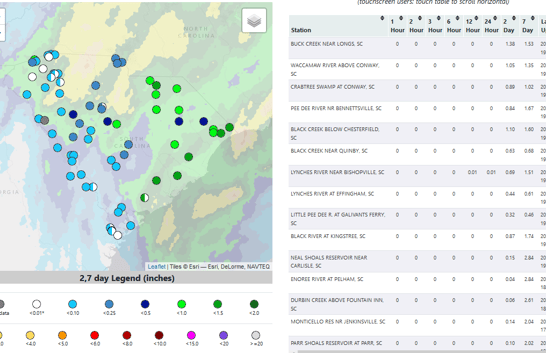
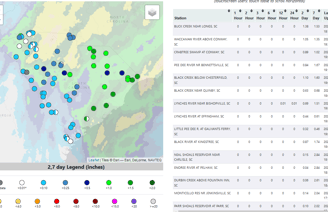
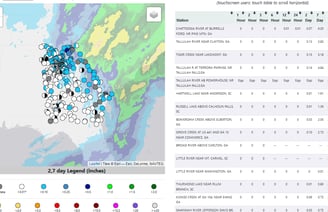
South Carolina only - USGS rain gauges with totals available in 1, 2, 3, 6, 12, 24, 48 hour maps as well as 7-day totals. Can add overlay of gauge numbers and radar estimated rainfall colors. Sort data on right.
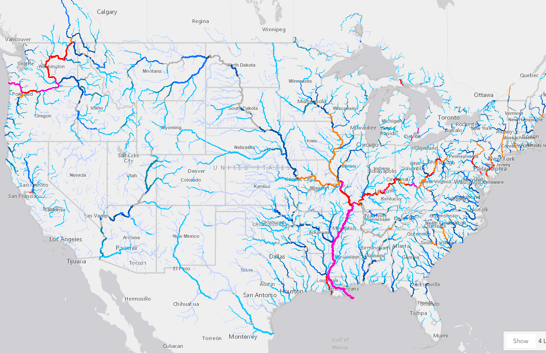
River Gauges
River Levels - Flood / Surge

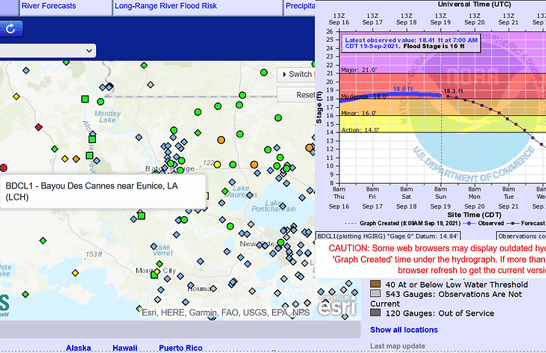
Interactive map and visual interactive map for river gauges. Zooming and and clicking a site marker typically shows detailed river height history and predicted crest.

NOAA/NWS interactive river gauge visualization mapping tool. This is currently considered experimental - planned opening Spring 2024.

While this is a tidal gauge interactive map, several gauges are found well upstream where tides may affect levels near ports or during more extreme weather events such as hurricanes.
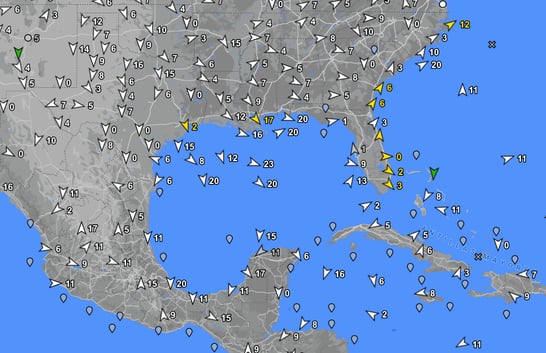
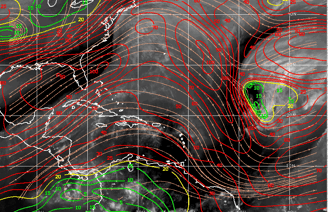
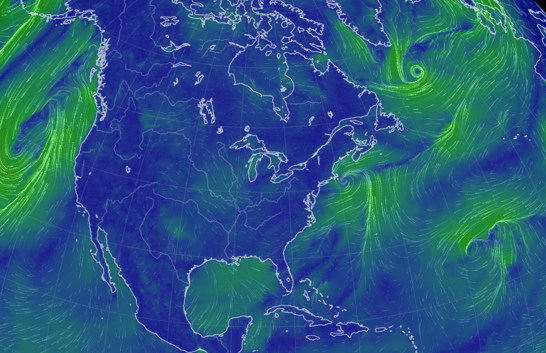
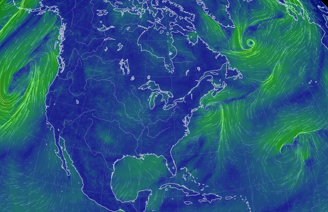
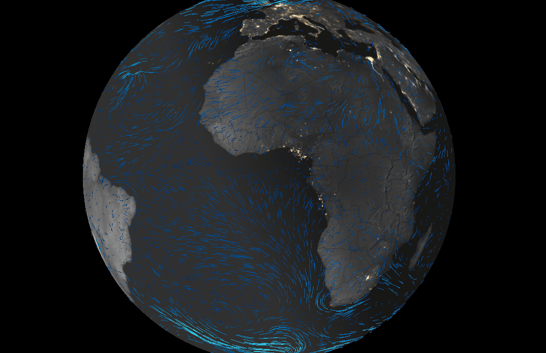
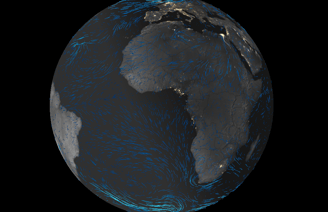
Wind
Wind speed & viz tools

Thousands of wind stations on interactive map, colored wind representations. Click any station for details on wind, wind gust, history, forecast and more.
Areas of high wind shear (red) typically hinder tropical cyclone (hurricane) development and can tear those storms apart. Low wind shear (green) is more favorable to Hurricane development. Yellow is medium wind shear values.

Visual representation of wind speeds at different heights. Click "Earth" in lower left corner for multiple options including SST's, wave heights and more!
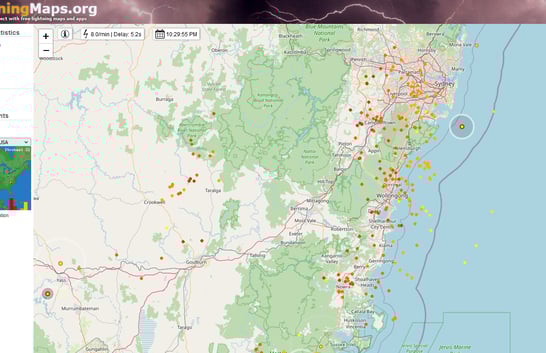
Interactive lightning map. Features both negative and positive lightning strikes (more powerful).
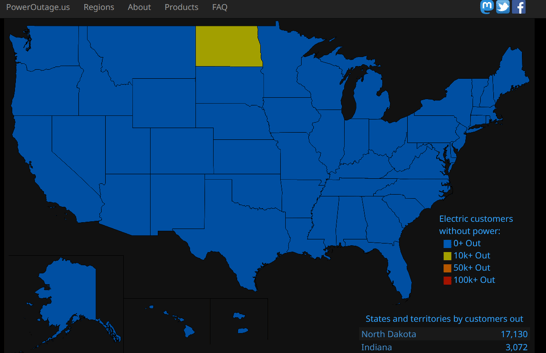
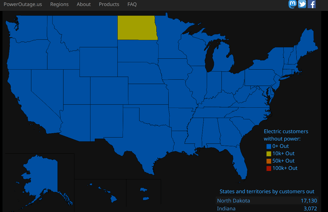
Power Outages
Power Outage maps / numbers

The most comprehensive US national power outage mapping site out there. View by national status, by state, or even by county. Break-down by power company as well. Follow their social media for regional views during storms.
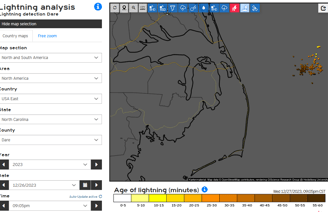
Lightning
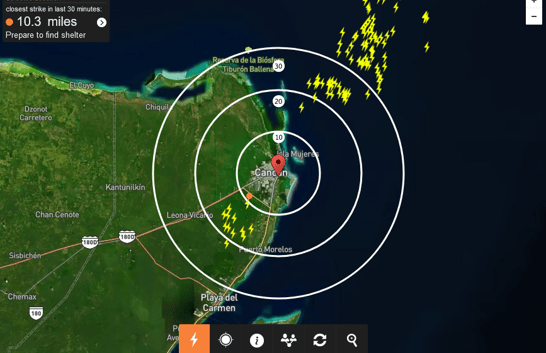
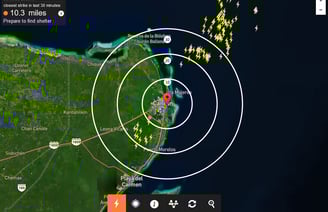
Can strike 10+miles from storm

Interactive map for several countries around the globe highlighting recent lightning strikes.

Interactive lightning map. With 'Spark' you get distance rings to help with how far lightning may be. Useful since lightning has been known to strike 10+miles away from the storm that made it. Also available in the WeatherBug app.
Interactive lightning map. Features both negative and positive lightning strikes (more powerful).

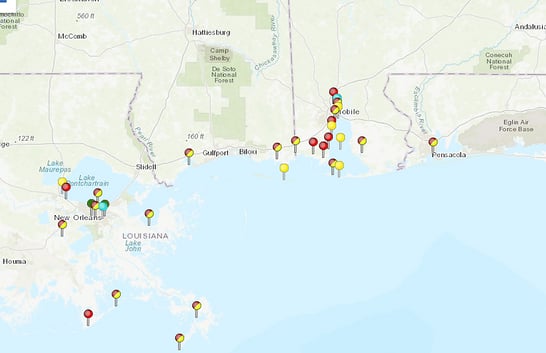
Tidal Gauges
Coastal tidal water levels

NOAA tidal gauge interactive map along with several gauges found well upstream where tides may affect levels near ports or during more extreme weather events such as hurricanes.
Interactive map and visual interactive map for river gauges. Zooming and and clicking a site marker typically shows detailed river height history and predicted crest.
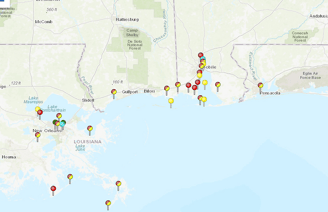
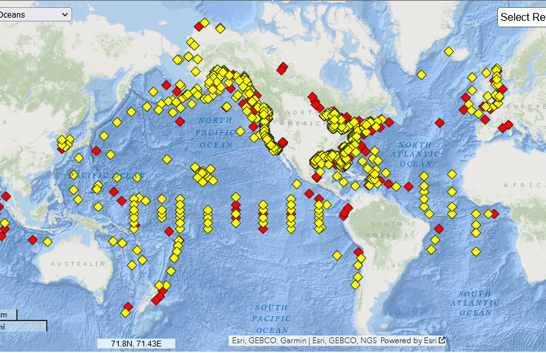
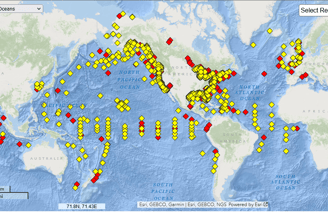
Buoy's
Buoy data and cams

Interactive map showing NOAA/NWS network of Buoy's. Various data types are available including wave heights, water temperature, wind speeds, etc. Yellow color means online, red offline.
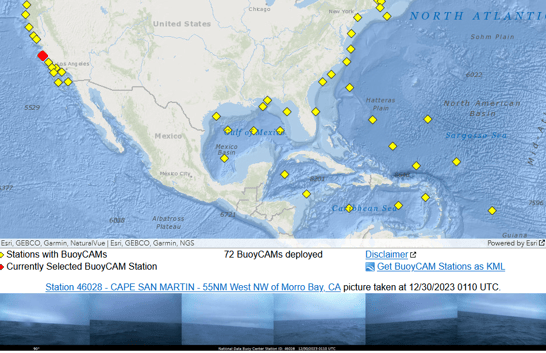
NOAA/NWS interactive buoy map showing the buoy's that contain cameras. Red color means offline, yellow online. Camera's update at various times buy typically every hour while daylight.

Traffic Cams
See the road conditions live

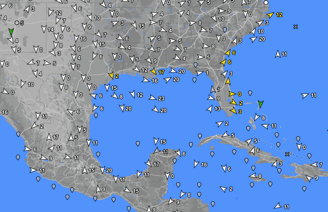
Airplane Traffic
View planes detour the storm

Live flight tracker, plane details, flight paths and much more. Free for simple viewing and tracking with paid options for additional features and details.

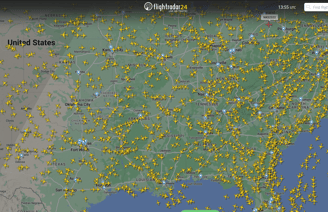
Live flight tracking, airport delays, weather radar included, plane details and more. Free for what most users may be seeking with paid options for additional features. (Note: Weather radar is simulated based on satellite imagery where radar sites are not present (ie: over oceans or countries with little to no radar coverage)).

Outdoor Cams
View on the ground conditions

Note the time/date to verify it's live/recent. Some may start with ads or have other video links beyond my control. Locations on map may not be exact but should generally be close. Cameras may eventually move / availability vary.
Crowd Source
Expedited data collections

Live flight tracker, plane details, flight paths and much more. Free for simple viewing and tracking with paid options for additional features and details.
Live flight tracking, airport delays, weather radar included, plane details and more. Free for what most users may be seeking with paid options for additional features. (Note: Weather radar is simulated based on satellite imagery where radar sites are not present (ie: over oceans or countries with little to no radar coverage)).
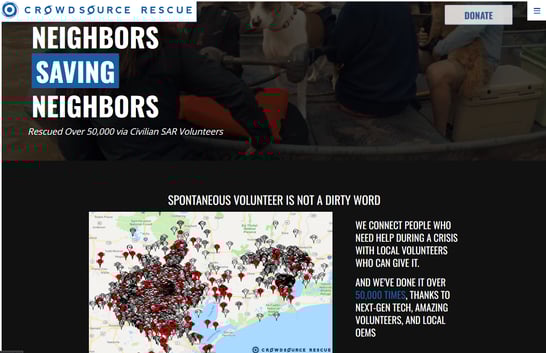
Note: Some crowd sourced options are not active until specific events begin to unfold or in the aftermath.