NWS WFO: GSP
WFO = Weather Forecast Office, in charge of a specific region.

NWS maps. Click image for latest from local NWS office. To choose a new area see here.
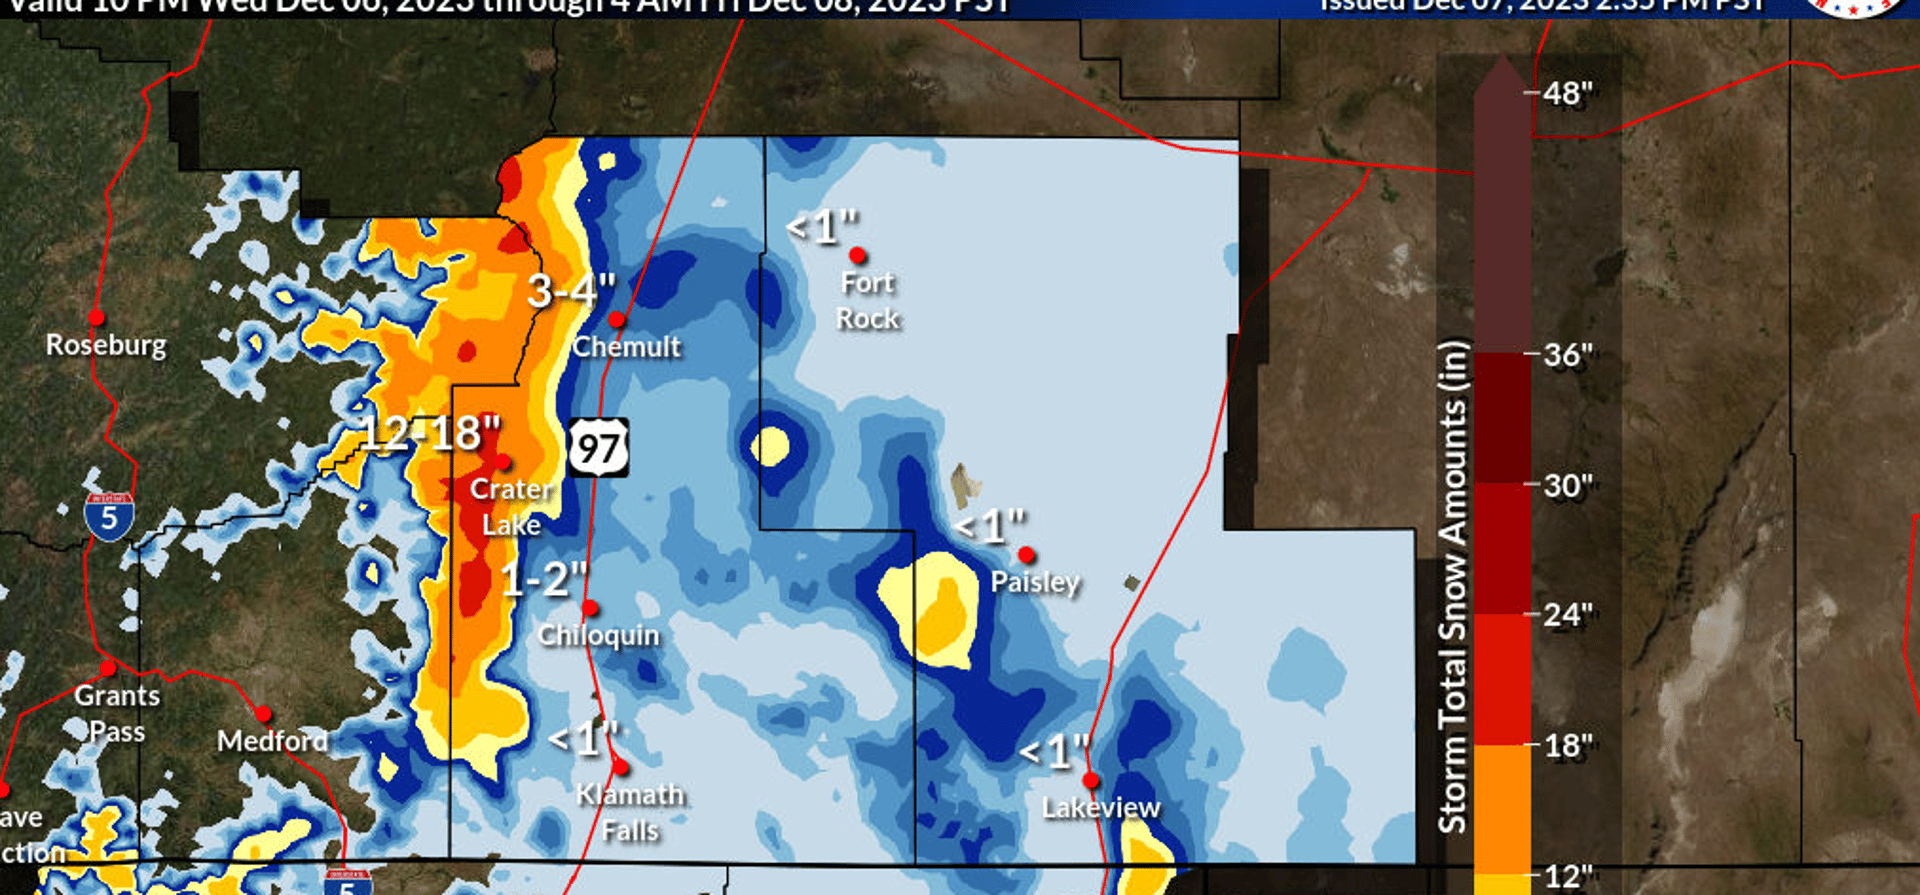
NWS expected snowfall map (Official forecast):
Note time range valid for and when issued at top of image
NWS low end map - 90% chance snow totals will be higher then shown:
NWS high end map - 90% chance snow totals will be less then shown:
Note time range valid for and when issued at top of image
Note time range valid for and when issued at top of image
To better communicate forecast uncertainty of this event, NWS offers low end and high end snow total maps (shown below). There is a 90% chance snow totals will be greater than the low end map shows. There is a 90% chance snow totals will be less then the high end map shows. (This also means there is a 10% chance snow totals will be less then the low end map, and 10% chance of snow totals being greater then the high end map). Showing both can help provide decision makers with low end and upper end range for planning purposes. The closer the low and high end snow total maps are to each other the higher the forecast confidence. The further apart the low and high end snow totals are the greater the forecast uncertainty.
For latest always see: https://www.weather.gov/gsp/winter
For latest always see: https://www.weather.gov/gsp/winter
Note: Some snow maps may include Sleet in totals. Final totals received may be dependent on multiple factors such as, but not limited to, ground warmth, rain/mix/sleet, temperature, wind blown snows, heavy snow compacting, etc.

Note: "ice" refers to "Freezing rain" (also known as 'the bad ice'), not 'sleet' which is frozen rain drops falling like tiny hail. Freezing rain is just regular rain when falling, which fools many into a false sense of safety. It becomes dangerous if temperatures are 32deg(F) or lower. Then that regular rain is likely freezing on contact with surfaces (hence 'freezing rain'). Just a thin amount on roadways can make any vehicle loose control. While Freezing Rain can form on any surface, it is likely to occur first on elevated surfaces such as trees, power lines and on bridges/overpass. Note: your vehicles display showing outside air temperature may not always match the actual air temperature due to several factors (including engine warmth affecting sensor, it's placement, tolerance, etc.).
NWS expected freezing rain (ice) map (Official forecast):
Note time range valid for and when issued at top of image
For latest always see: https://www.weather.gov/gsp/winter
A rough general guideline of what to maybe expect can be:
(and can be dependent on local tree types, road treatments, electrical grids, terrain, ground warmth, etc.):
0.01" (glisten on trees, no real issues)
0.10" (bridge/overpass issues, potential spotty road issues)
0.25" (start of tree/power issues, trees bend, widespread road issues)
0.50" (scattered to widespread tree/power issues, roads hazardous)
1.00" (major tree/power issues, roads hazardous)

NWS Percent Chance Maps:
Various maps ranging from 0.1" to 18". Not a forecast.
For latest always see: https://www.weather.gov/gsp/winter
Note time range valid for and when issued at top of image