Central Pacific
Pacific, North of equator from 140w Westward to 180w
Area: Pacific North of the Equator from 140w Westward to 180w
Basin Details
Season: 1 June - 30 November (Peak: July-September)
Season notes: Average season: 4 to 5 systems (Some storms can come from East Pacific as well)
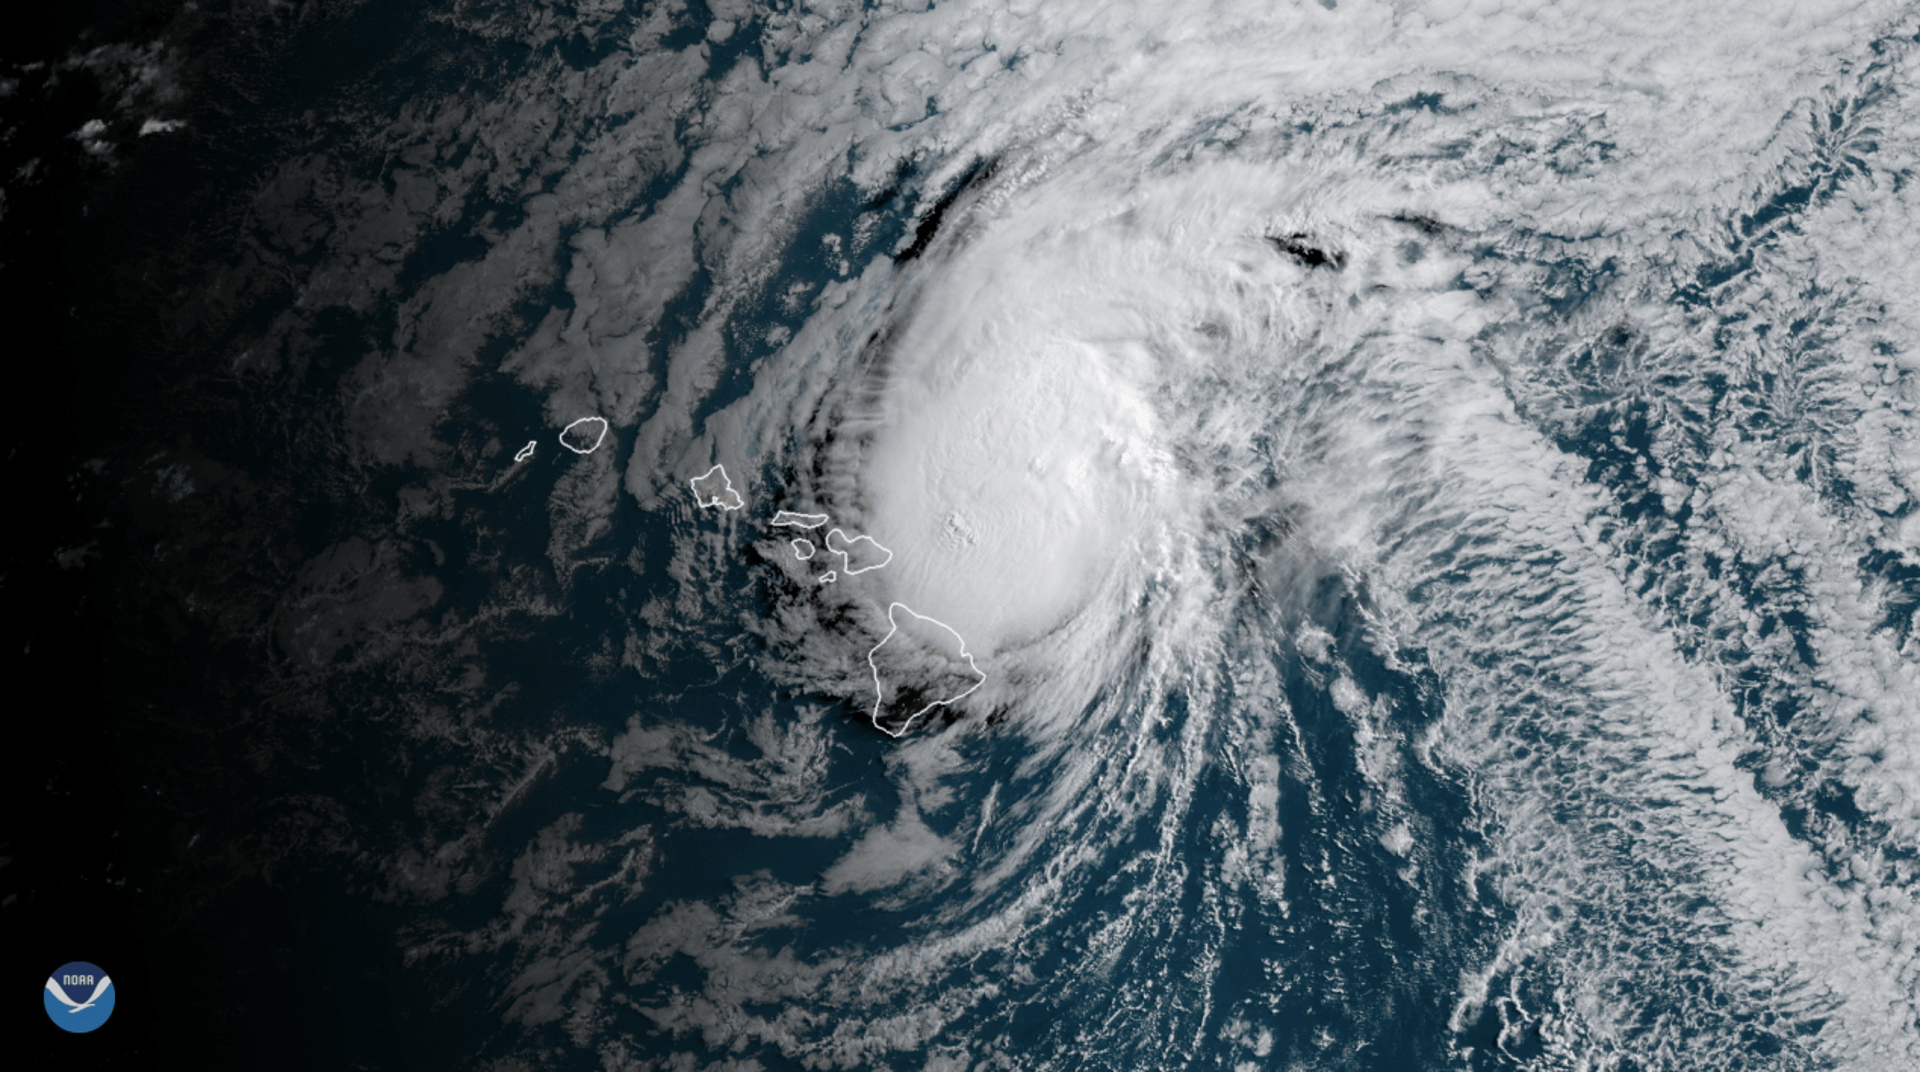
Current Storms
Note: See below first map for specific storm data.
This image updates every six hours from 1June-30November at 5 & 11am/pmHST, 5 & 11am/pmEDT(4 & 10a/pEST); 2 & 8am/pmPDT(1 & 7a/pPST). It will also update any time as needed (ie: for a January system, etc.). Date & Time last updated located in bottom left.
Future Storms
This image updates every six hours from 1June-30November at 2 & 8am/pmHST, 2 & 8am/pmEDT(2 & 7a/pEST); 5 & 11am/pmPDT(4 & 10a/pPST). It will also update any time as needed (ie: for a January system, etc.). Date & Time last updated located in bottom left.
Next two days:
Next seven days:
(NHC moved from 5-day to 7 in 2023)
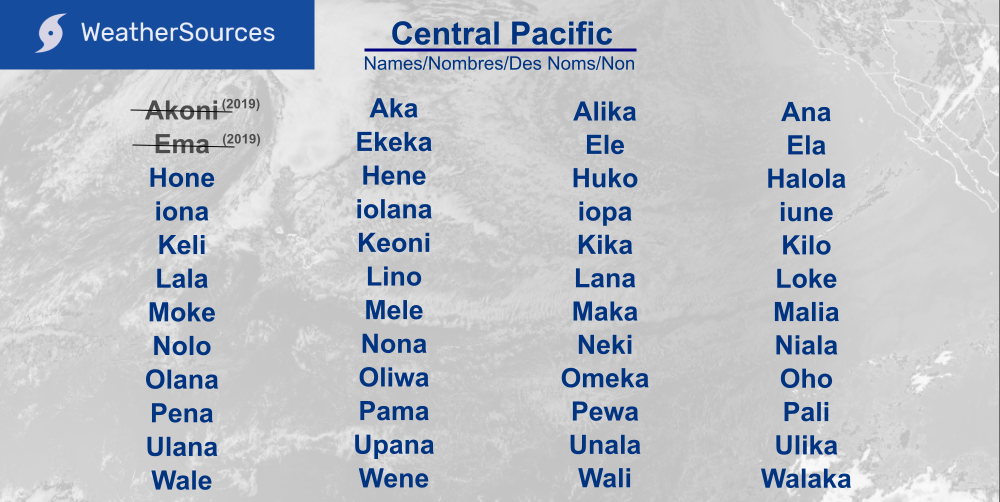
Storm Names
North Central Pacific storms use a series of four name list used in order as needed unless retired by the World Meteorological Organization (WMO). Unlike the Atlantic or East Pacific basins, names here do not change for each season/year. Instead the next available name is used for each storm. Storms traveling from the East Pacific into the Central Pacific retain their original name. NHC provides a list of names & pronunciation list here.

Averages / History


Studying the past can help you plan the future. From beach trips, shipping cargo, insurance cost, to keeping your home safe, etc. Averages are averages, so storms can fall outside of the data, dates & boundaries shown below.
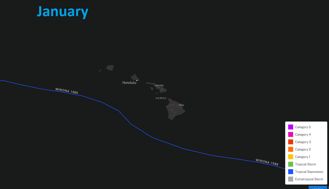
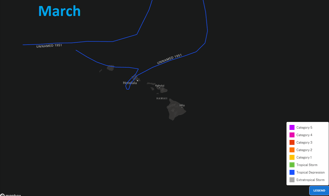
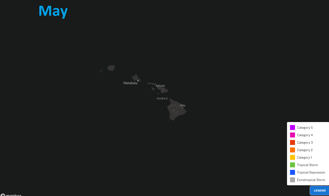
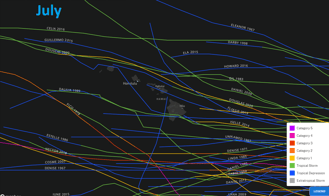
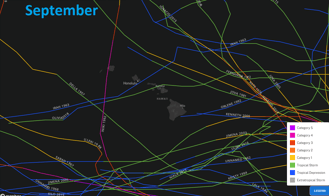
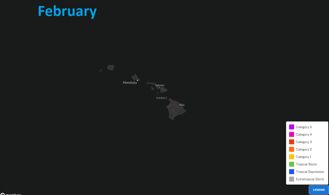
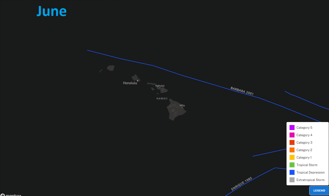
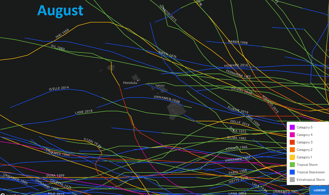
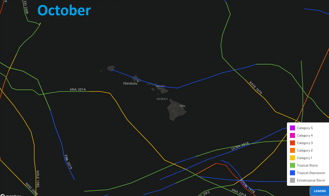
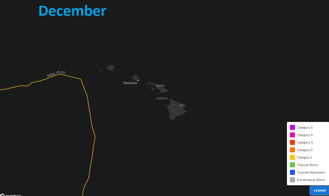
Closeup of the main Hawaii islands showing monthly historical tracks for the Central Pacific basin from January to December. Some originate from the Eastern Pacific, and some continue on to the Western North Pacific.
Image credit: NHC/NOAA (Source); month text added to original image; data 1949 to 2021.
Note: Weather satellites did not exist until 1960's, some data may be missing.
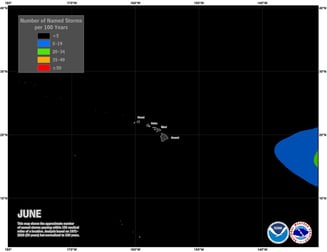
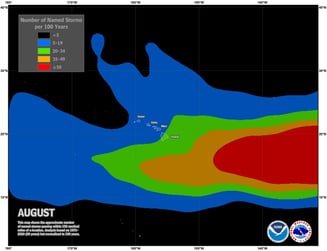
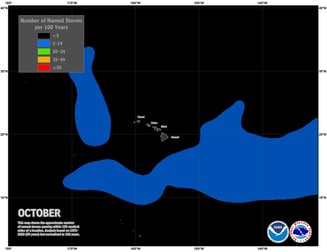
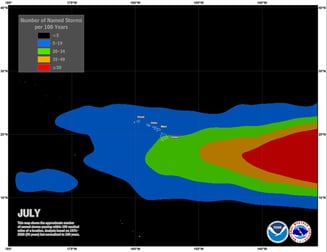
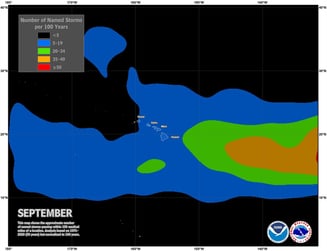
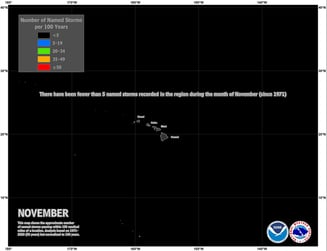
Regions where more than ten named storm centers have previously passed within 173miles (150 nautical miles). Colors represent number of storms (ie: blue = between 5 and 19 storms, red =more than 50, etc.). Some storms originate from the East Pacific.
Image credit: NHC/NOAA (Source); data 1971 to 2020.
Note: Weather satellites did not exist until 1960's, some data may be missing.
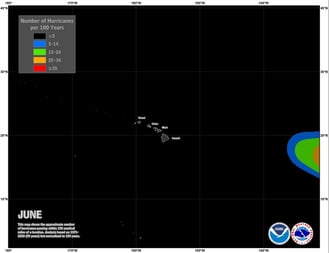
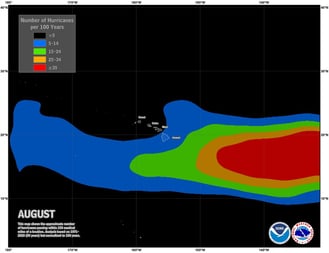
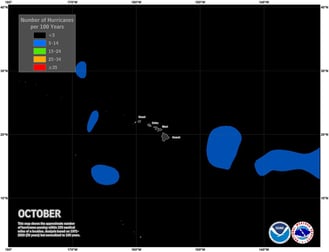
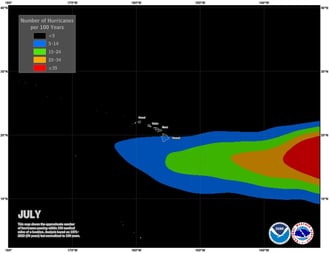
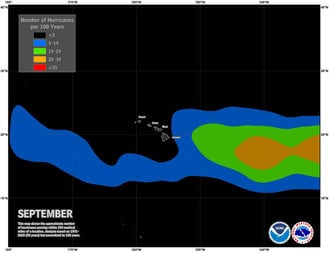
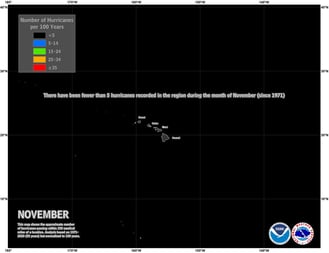
Regions where more than ten Hurricane centers have previously passed within 173miles (150 nautical miles). Colors represent number of storms (ie: blue = between 5 and 14 storms, red =more than 35, etc.). Some storms originate from the East Pacific.
Image credit: NHC/NOAA (Source); data 1971 to 2020.
Note: Weather satellites did not exist until 1960's, some data may be missing.
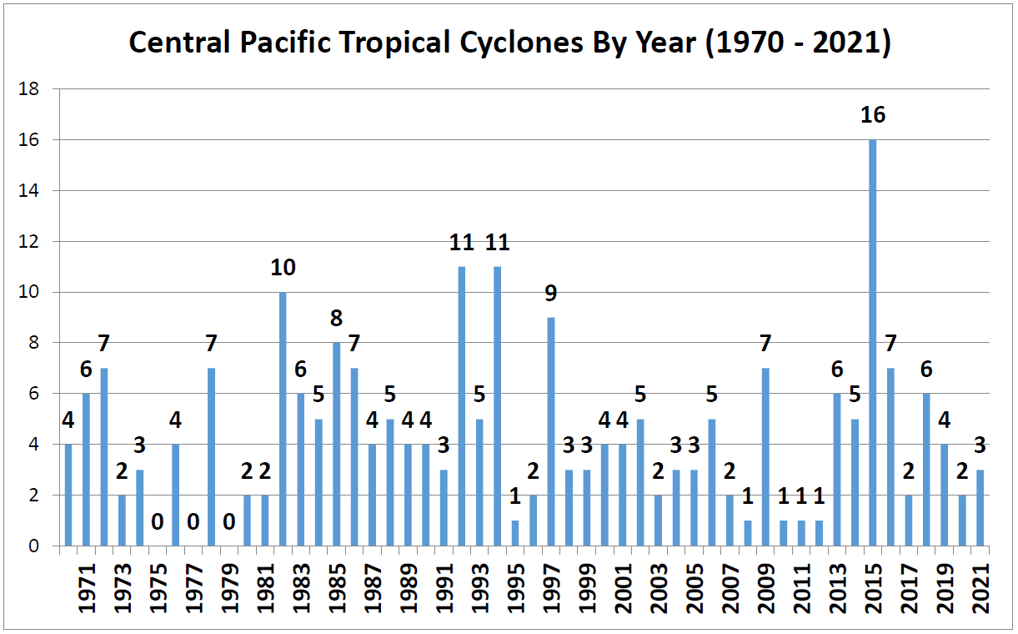
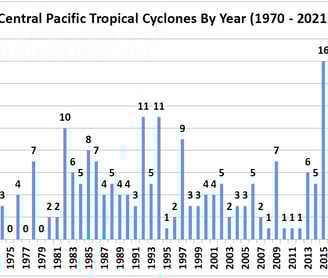
Annual number of tropical systems that formed in or traveled into the Central Pacific basin.
Image credit: NHC/NOAA (Source); Data 1970 to 2021.
Monthly historical tracks for the Central Pacific basin from January to December. Some originate from the Eastern Pacific, and some continue on to the Western North Pacific.
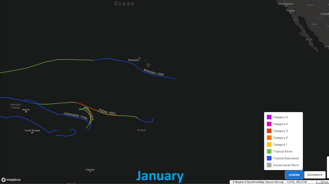
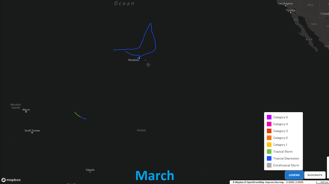
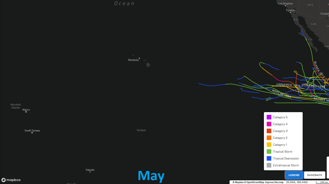
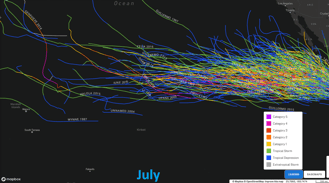
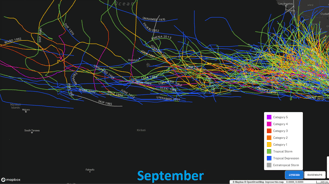
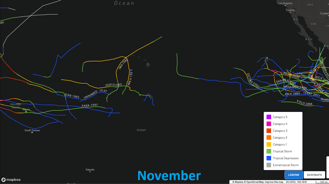

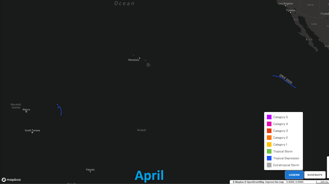
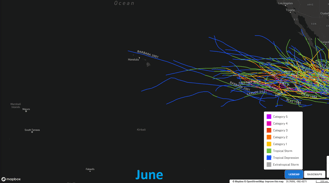
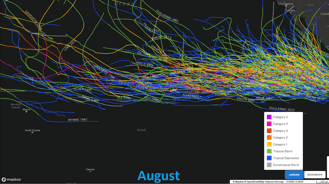
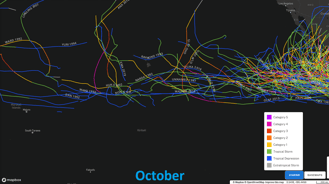
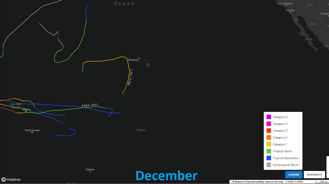
Image credit: NHC/NOAA (Source); month text added to original image; data 1949 to 2021.
Note: Weather satellites did not exist until 1960's, some data may be missing.
Image at top of page: Hurricane Douglas 26 July 2020 by NOAA