
North Atlantic
Gulf of Mexico, Caribbean, Atlantic (North of equator)
Area: Gulf of Mexico, Caribbean & Atlantic (North of equator)
Basin Details
Season: 1 June - 30 November (Peak: September)
Governing Body: US National Hurricane Center (NHC)
Start date could move to 15May eventually (NHC for this change, WMO against for now)
Average season: 14 named storms, 7 hurricanes, 3 major(Cat3+)
Storms can form any month but most found May through November time frame.
Current Storms
Note: See below first map for specific storm data.
This image updates every six hours from 1June-30November at 5 & 11am/pmEDT(4 & 10a/pEST); 4 & 10am/pmCDT(3 & 9a/pCST); 7 & 1am/pmADT(6 & 12a/pAST). It will also update any time as needed (ie: when outlooks are updated (2 & 8a/pEDT), for a January system, etc.). Date & Time last updated located in bottom left.


Invest 90L
Temporary page dedicated to satellite imagery and other storm information
Future Storms
NHC's outlook maps ("TWO" product: Tropical Weather Outlook) showing areas being monitored for possible tropical trouble next two and next seven days. Those areas are highlighted as Low, Medium and High chance of tropical development.
Next two days:
Next seven days:
(NHC moved from 5-day to 7-day outlooks in 2023)
These images updates every six hours from 15May-30November at or before 2 & 8am/pmEDT(1 & 7a/pEST); 1 & 7am/pmCDT(12 & 6a/pCST); 3 & 9am/pmADT(2 & 8a/pAST). It will also update any time as needed (ie: for a potential system outside those dates, a more rapid changes outside those times, etc.). Date & Time last updated located in bottom left corner.
Storm Names
Storm names repeat every six years unless retired by the World Meteorological Organization (WMO). Because storms affect multiple countries, name list generated by WMO. NHC provides a list of upcoming names & pronunciation list here.
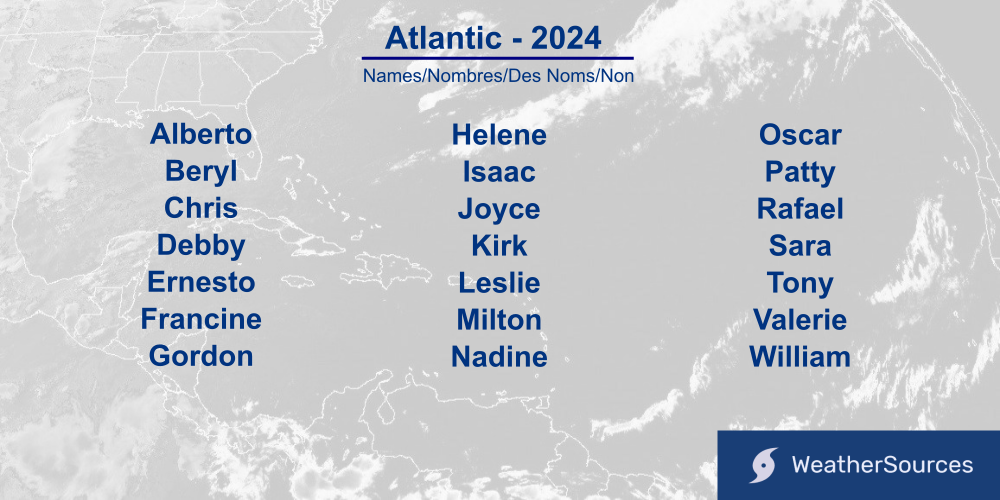
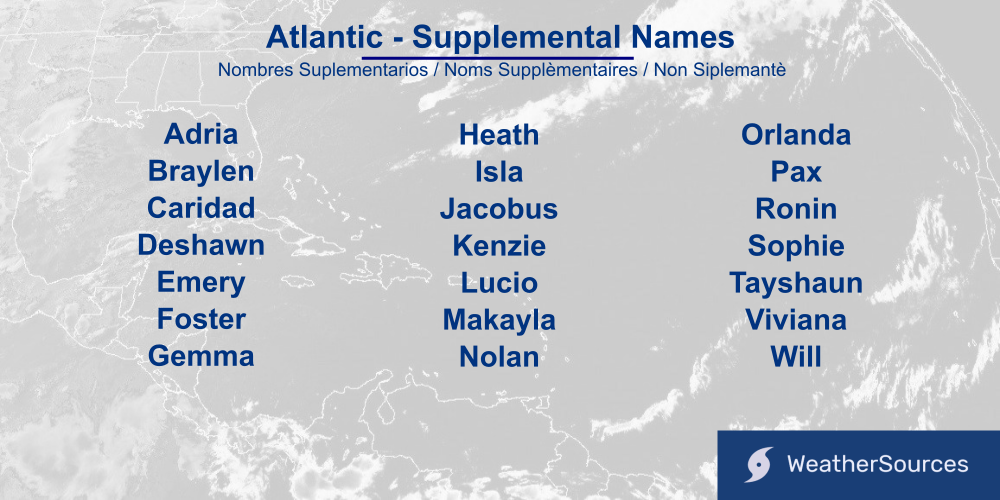
What happens if all the names area used?
In previous years the Greek alphabet was used (Alpha, Beta, Gamma, etc.). Starting in 2021 a supplemental name list now utilized.

Averages / History


Studying the past can help you plan the future. From beach trips, shipping cargo, insurance cost, to keeping your home safe, etc. Averages are averages, so storms can fall outside of the data, dates & boundaries shown below.
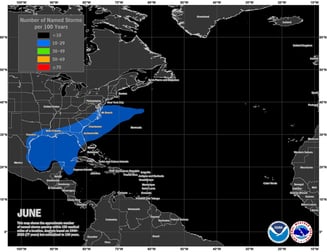
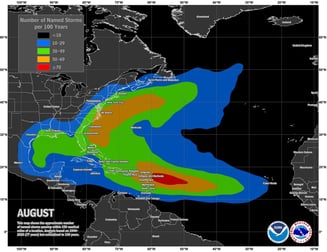
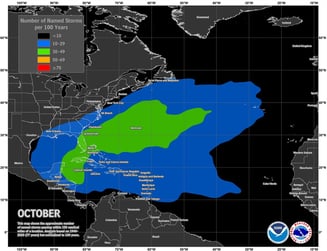
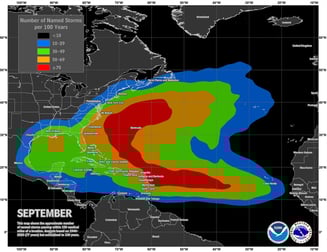
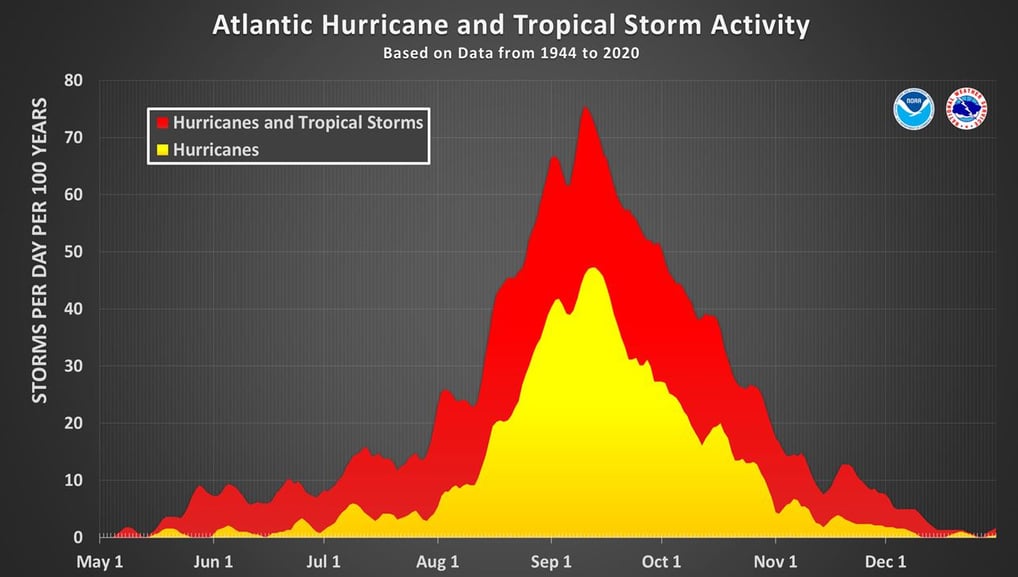
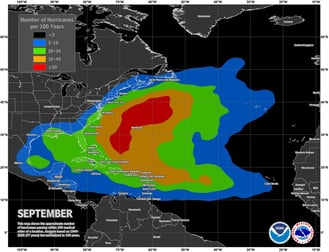
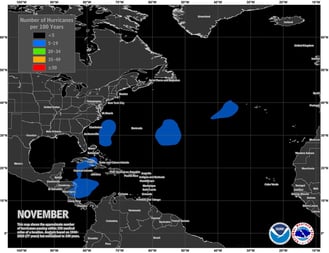
Past activity clearly shows September is typically peak of the Atlantic Hurricane season in terms of number of named storms.
Image credit: NHC/NOAA (Source); data 1944 to 2020.
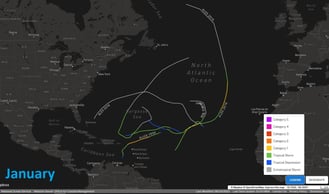
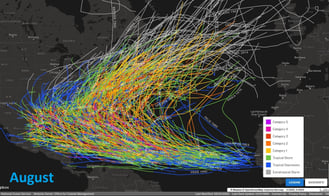
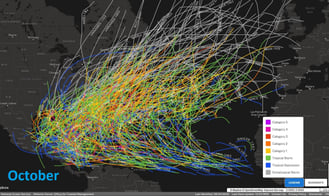
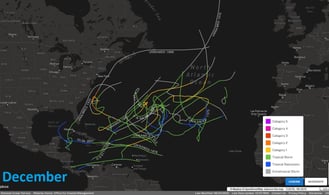
Monthly historical tracks for the Atlantic basin from January to December, years 1851-2021.
Image credit: NHC/NOAA (Source); month text added to original image; data 1851 to 2021.
Note: Weather satellites did not exist until 1960's, some data may be missing.
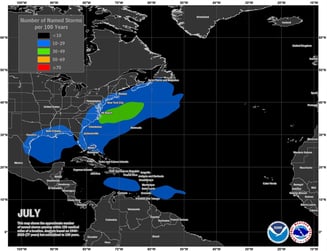
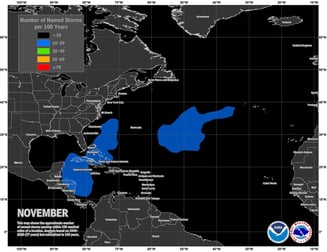
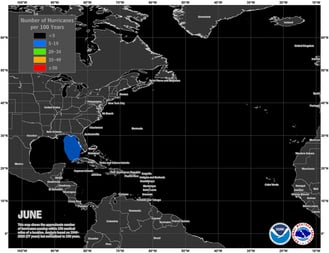
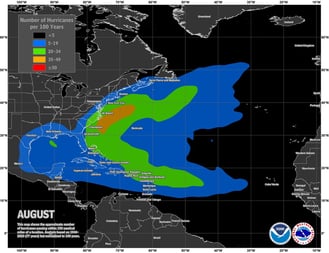
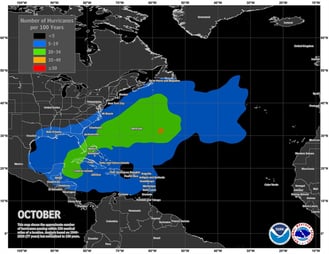
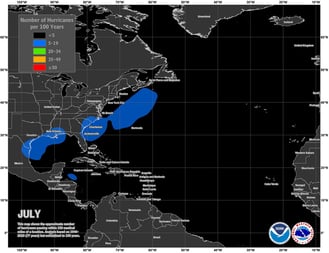
Regions where more than ten named storm centers have previously passed within 173miles (150 nautical miles). Colors represent number of storms (ie: blue = between 10 and 29 storms, red =more than 70, etc.)
Image credit: NHC/NOAA (Source); data 1944 to 2020.
Note: Weather satellites did not exist until 1960's, some data may be missing.
Regions where more than ten Hurricane centers have previously passed within 173miles (150 nautical miles). Colors represent number of storms (ie: blue = between 5 and 19 storms, red =more than 50, etc.)
Image credit: NHC/NOAA (Source); data 1944 to 2020.
Note: Weather satellites did not exist until 1960's, some data may be missing.
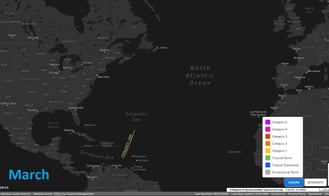
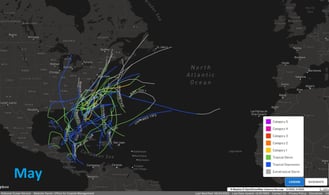
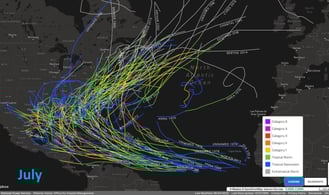
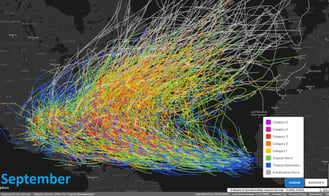
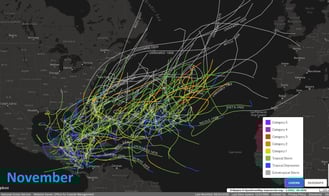
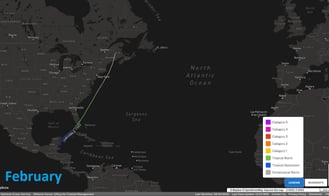
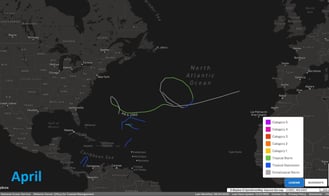
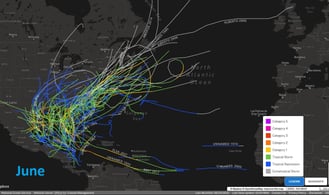
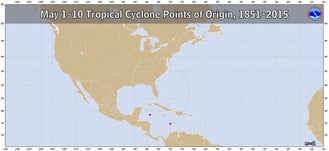
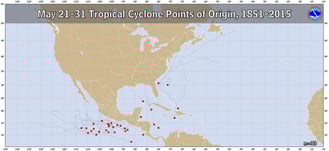
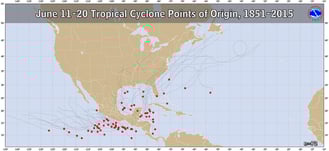
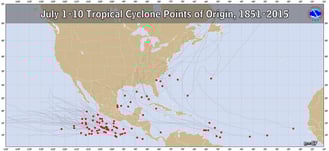
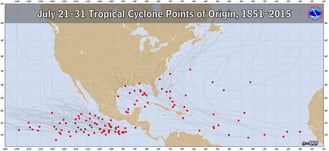
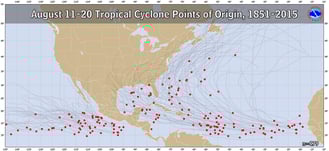
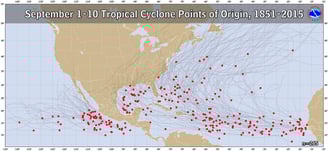
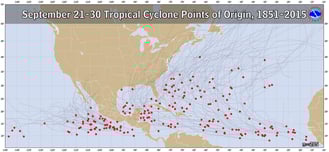
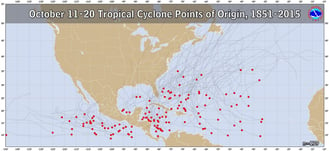
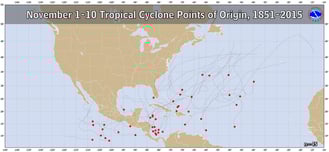
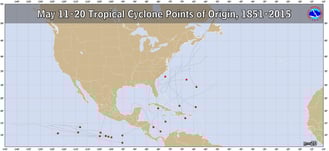
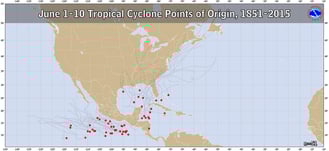
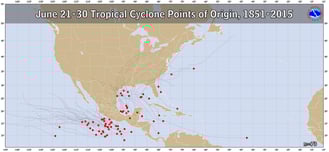
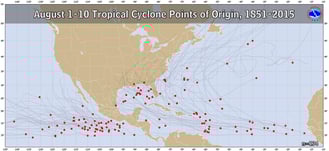
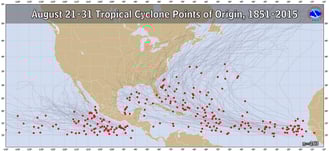
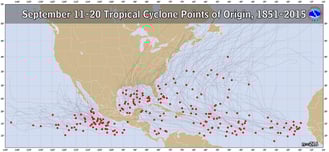
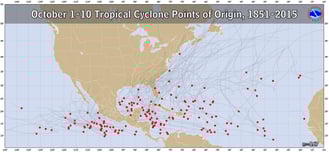
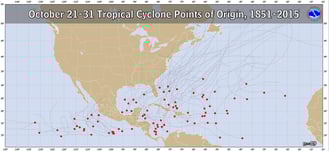
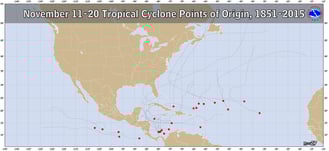
Named storm origin points (red dots) and their tracks (thin lines). Each graphic is for a ten day period (month / days top of image). This can help show when busier times are more likely, general steering patterns that time of year, where storm formation common or uncommon, etc.
Image credit: NHC/NOAA (Source); Atlantic data 1851 to 2015, Pacific data 1949-2015.
Note: Weather satellites did not exist until 1960's, some data may be missing.
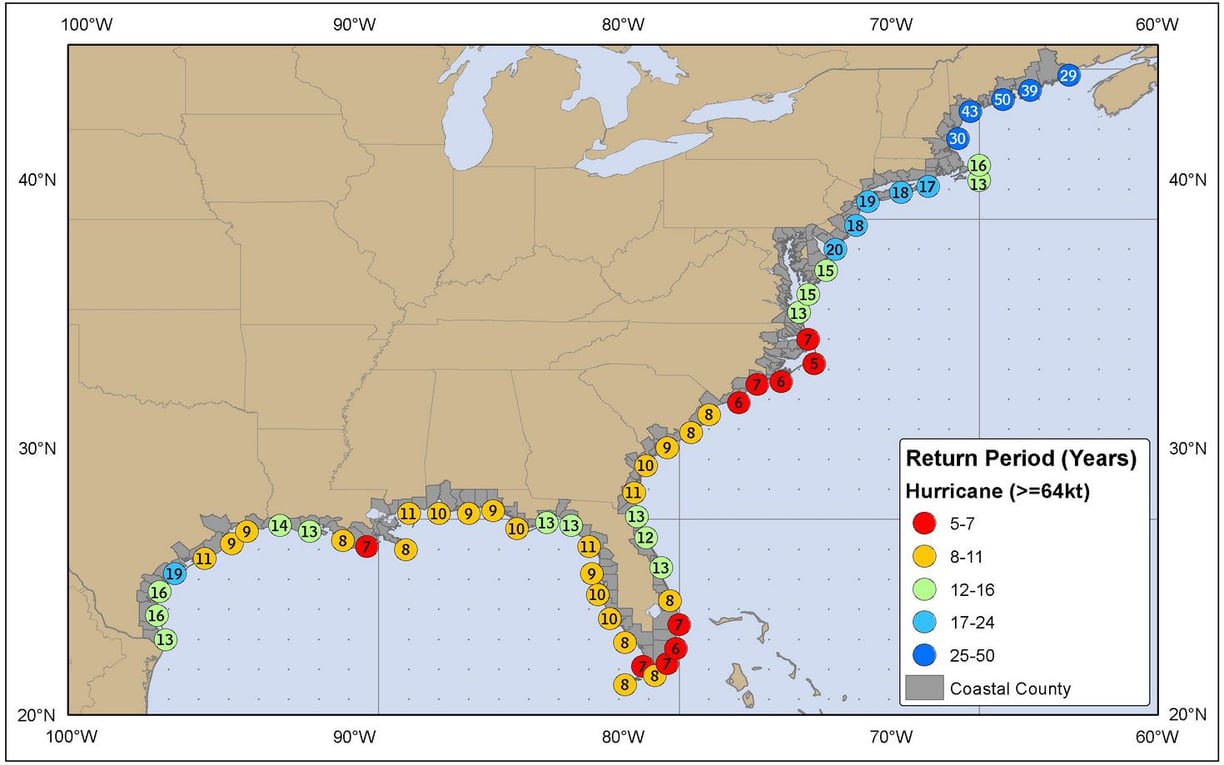
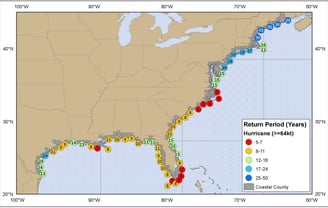
Average number of years for a Hurricane rated storm center to pass within 58miles (50 nautical miles) of the points shown. These are averages, and storms could still hit back to back, even in the same calendar year. This does not illustrate risk, just average return period in years. Numbers may change as more data is collected.
Image credit: NHC/NOAA (Source); data from 1987 HURISK program, updated through 2010.
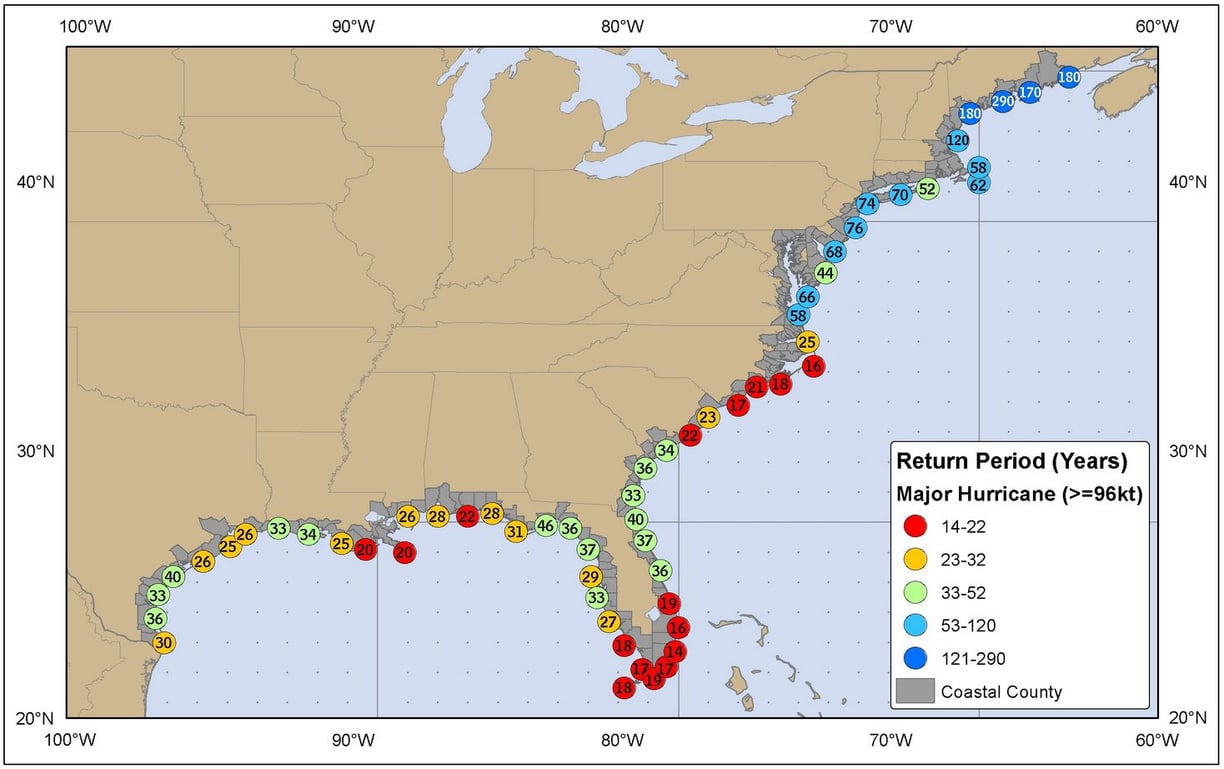
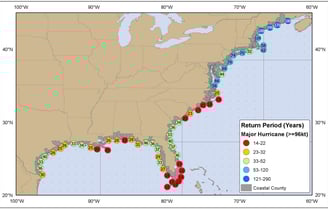
Average number of years for a Major Hurricane (Cat3, 4, or 5) rated storm center to pass within 58miles (50 nautical miles) of the points shown. These are averages, and storms could still hit back to back, even in the same calendar year. This does not illustrate risk, just average return period in years. Numbers may change as more data is collected.
Image credit: NHC/NOAA (Source); data from 1987 HURISK program, updated through 2010.
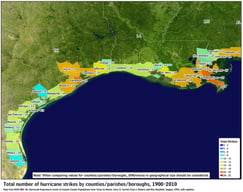
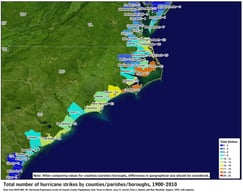
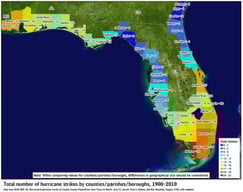
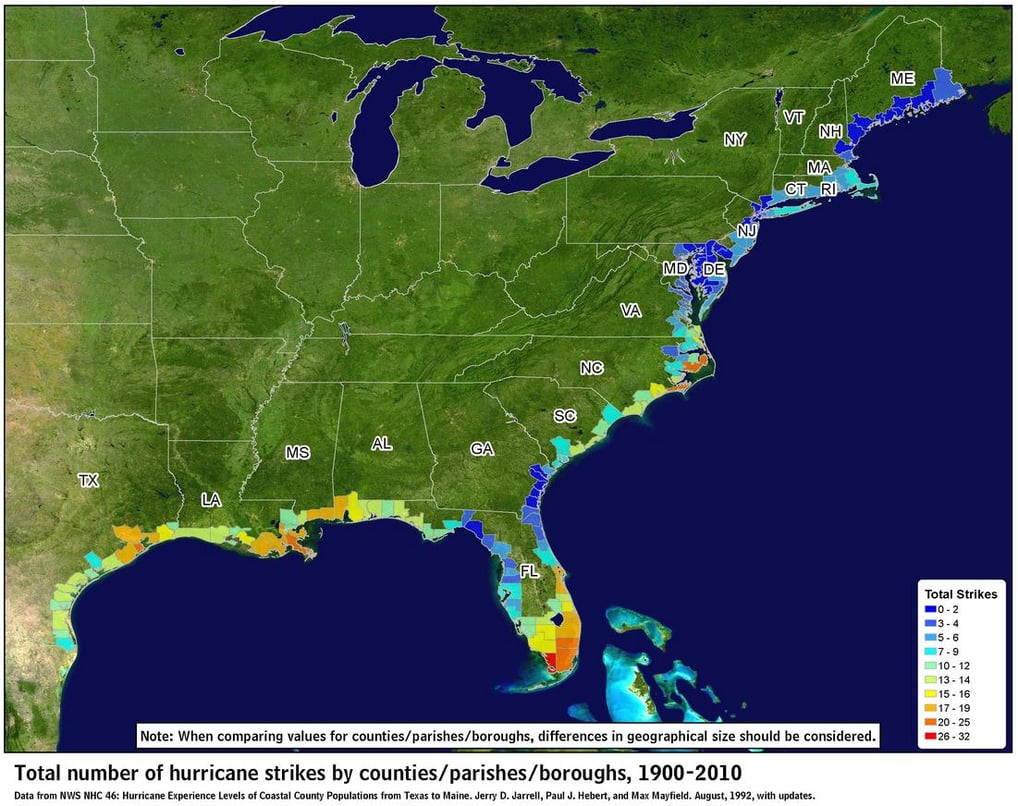
Number of US Hurricane landfalls (storm center point) by county, parish, borough. This does not account for the wide reaching impacts Hurricanes bring, storm surge, close passes, etc. Data 1900 through 2010.
Image credit: NHC/NWS/NOAA & Jerry D. Jarrell, Paul J. Hebert, Max Mayfield (Source); updates made to original work: data now includes 1900 to 2010.
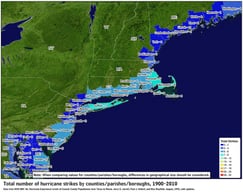
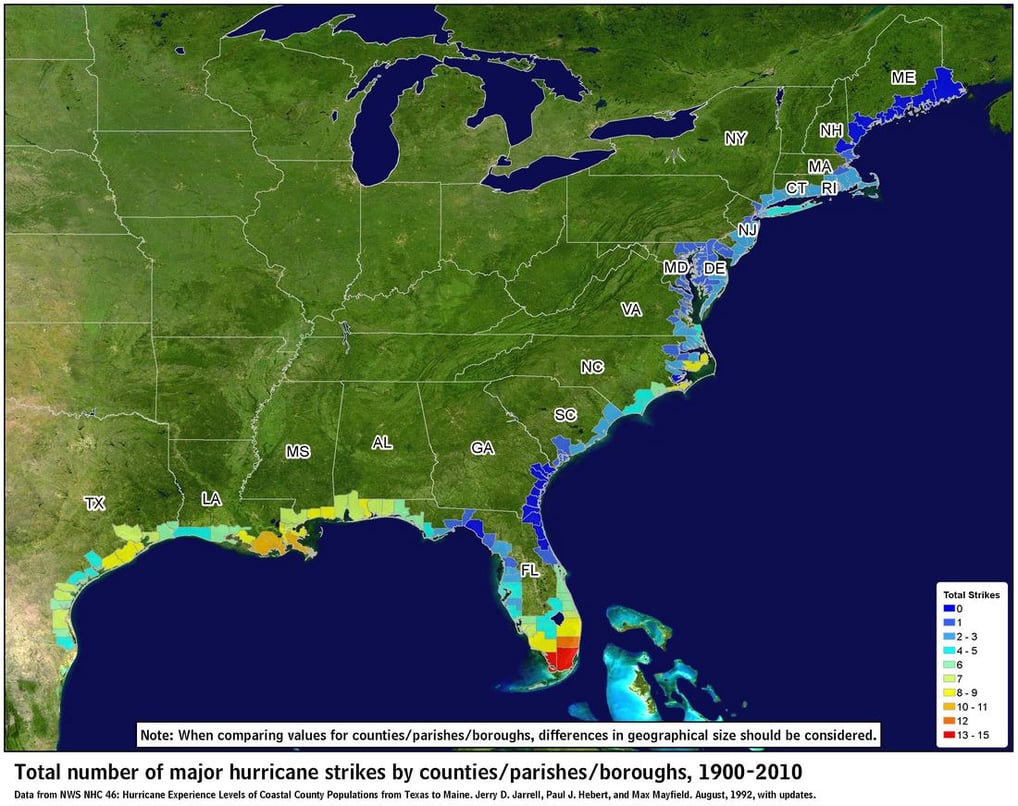
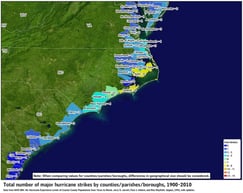
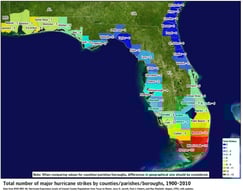
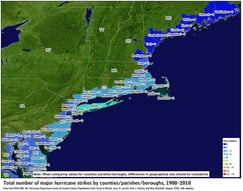
Number of US Major Hurricane (Cat3, 4 or 5) landfalls (storm center point) by county, parish, borough. This does not account for the wide reaching impacts Hurricanes bring, storm surge, close passes, etc. Data 1900 through 2010.
Image credit: NHC/NWS/NOAA & Jerry D. Jarrell, Paul J. Hebert, Max Mayfield (Source); updates made to original work: data now includes 1900 to 2010.